
Categories
Community Spotlights, Home Buying TipsPublished July 29, 2026
Where Can You Get the Most House for Your Money in Philadelphia County Under $350K?

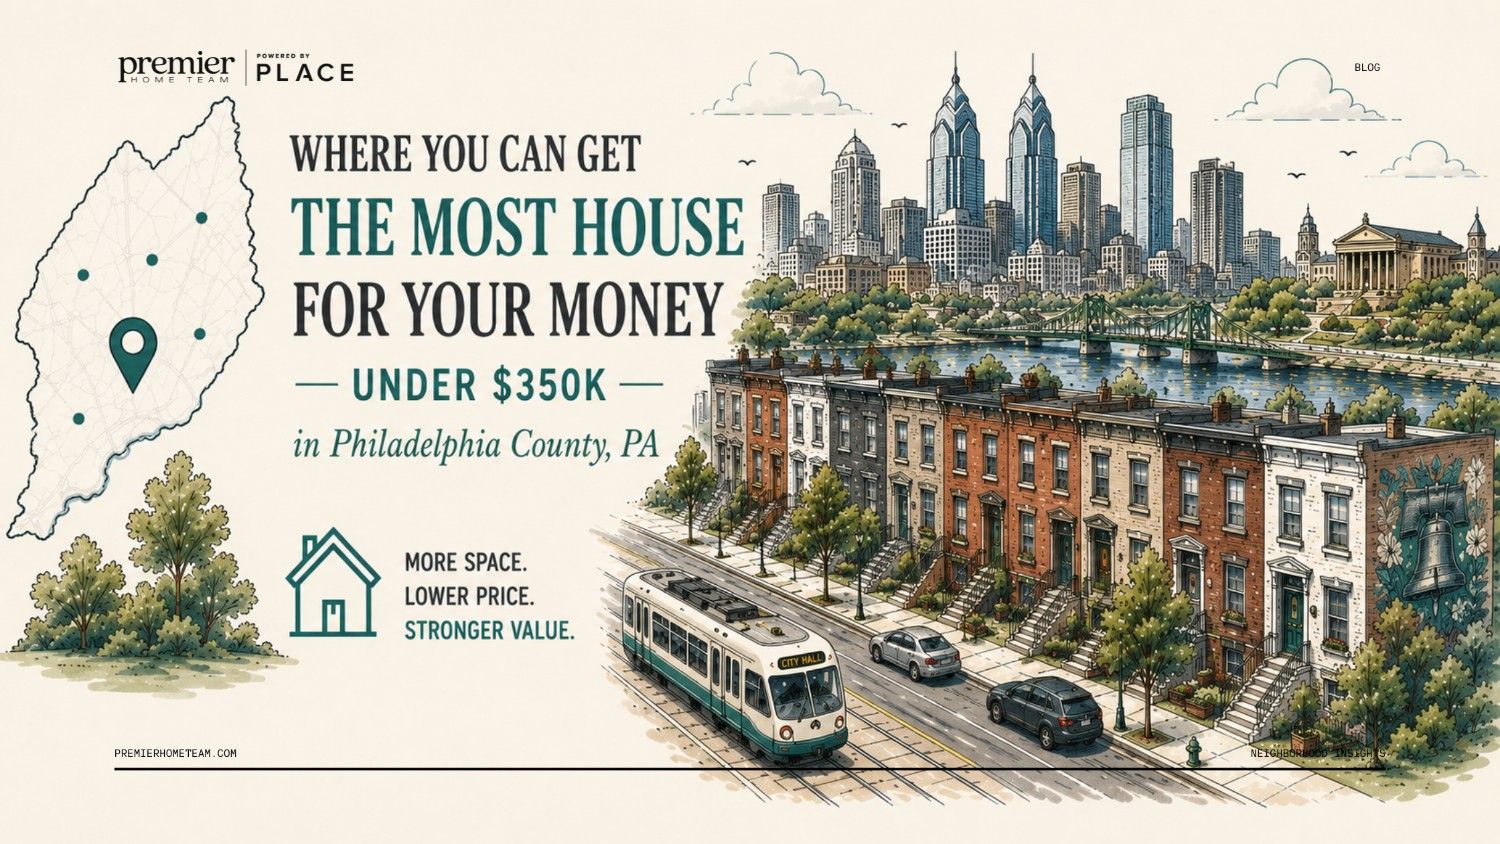
If you've been searching for a home in Philadelphia under $350K, you've probably noticed that "affordable" doesn't mean the same thing in every neighborhood. In some areas, that budget drops you into an all-out bidding war, offers due in 24 hours, waived inspections, and prices going 5% over ask. In others, that same money buys you more house, more time to think, and a real conversation with the seller.
So where can buyers under $350K find the strongest combination of affordability, inventory, and negotiating room?
To answer that question, we analysed recent Bright MLS sales data and ranked the neighborhoods in Philadelphia County that offer the strongest value right now. Below are the five neighborhoods that scored highest on our Value Score. All of them are selling. They just offer a different experience from the most competitive neighborhoods on our other list.
We'll also show you how to use both lists together to match your strategy to the right neighborhood, because the right answer depends entirely on what kind of buyer you are.
| Neighborhood | Best For: | Med. Price |
| Elmwood Park | Buyers seeking the lowest entry price | $150k |
| Germantown (East) | Buyers who want the most negotiating room | $150k |
| Frankford | Buyers balancing affordability and market activity | $175k |
| Logan | Buyers hoping to negotiate below the asking price | $150k |
| Port Richmond | Buyers who want the most inventory and flexibility | $225k |
How We Defined Philadelphia County's Best Value Neighborhoods in This Analysis
To identify Philadelphia County's best value neighborhoods under $350K, we analyzed 90 days of closed sales data from Bright MLS, covering transactions from March to June. We also reviewed a snapshot of active listings to better understand inventory levels, buyer competition, and negotiating leverage across the county.
A neighborhood isn't a strong value simply because it has the lowest home prices. It's a strong value when buyers have the best combination of affordability, inventory, negotiating room, and market activity.
To measure that, we evaluated every qualifying Philadelphia neighborhood using four metrics:
| Metric | What It Measures | Why It Matters for Value Buyers |
| Median Sold Price | Middle sold price over 90 days | Lower price = more home for your budget (4× weight) |
| Days on Market (DOM) | Avg. time before contract | More days = more time to negotiate, less panic pressure (2× weight) |
| % Sold At/Above Ask | How often sellers get full price | Lower % = buyers still winning negotiations (2× weight) |
| Closed Sales Volume | # of sales in 90 days | Confirms the market is real and active, not distressed (1× weight) |
To keep the rankings meaningful, we only included neighborhoods with sufficient sales activity during the 90-day study period.
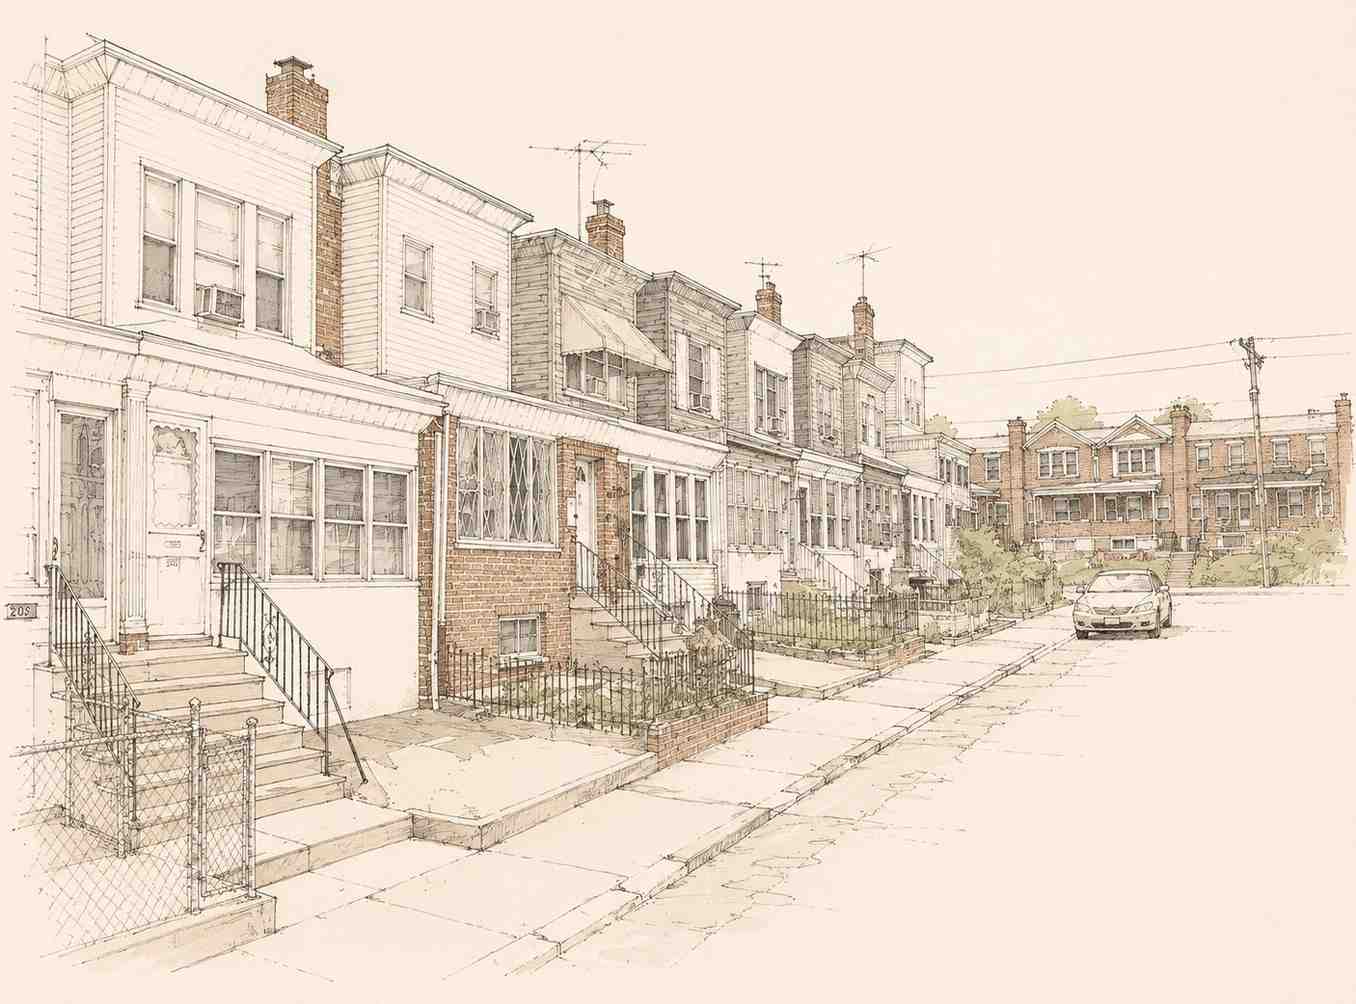
Elmwood Park
| Median Sold Price (90 days) | $150,000 |
| Average Days on Market | 54.6 days |
| % Sold At or Above Asking | 60.0% |
| Avg. List-to-Sale Ratio | 0.988 |
| Closed Sales (90 days) | 25 sales |
| Active Listings (snapshot) | 29 active listings |
At a median sold price of $150,000, Elmwood Park is one of the most affordable neighborhoods on this list, and the numbers behind it tell a healthier story than the price alone might suggest. Homes are selling, buyers are active, and 60% of transactions are still closing at or above asking. This isn't a dead market; it's an affordable one.
The 54.6-day average DOM means you have real time to research a home, schedule an inspection, and come in with a considered offer, something buyers are much less likely to experience in Philadelphia's hottest under-$350K markets. The 29 active listings (one of the higher totals in this tier) means you'll have options to compare.
A lot of the homes in Elmwood Park have been owned long-term, which can skew the data since many of those properties aren't move-in-ready and sit on the market longer. Move-in ready homes here tend to see real competition, so don't be afraid to go for the ones that check your boxes.
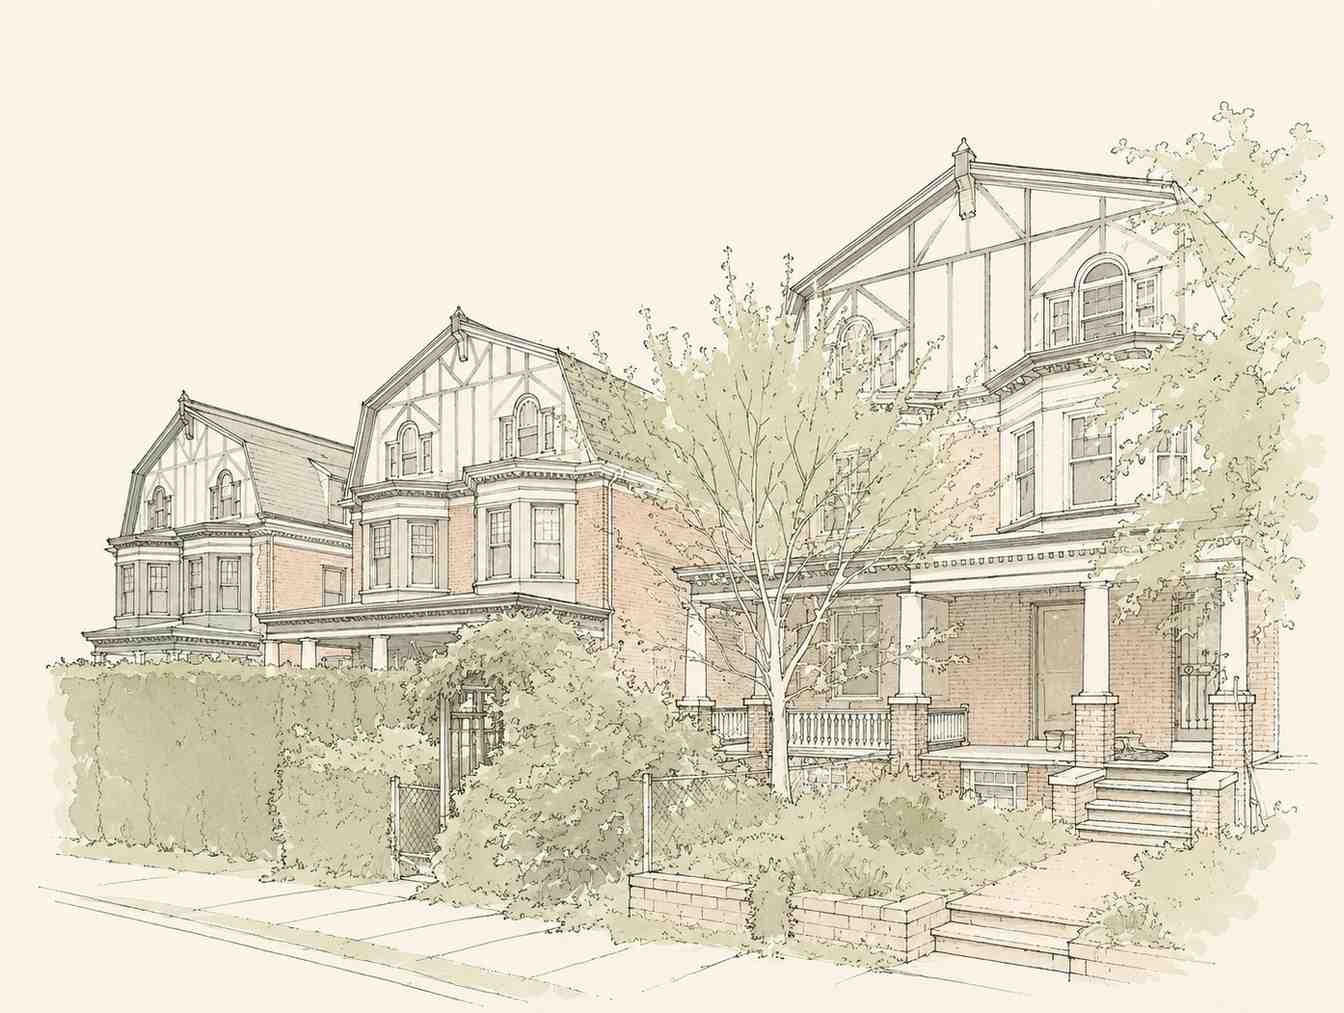
Germantown (East)
| Median Sold Price (90 days) | $149,950 |
| Average Days on Market | 64.7 days |
| % Sold At or Above Asking | 50.0% |
| Avg. List-to-Sale Ratio | 0.976 |
| Closed Sales (90 days) | 20 sales |
| Active Listings (snapshot) | 23 active listings |
East Germantown offers the most negotiating room of any neighborhood on this list. With an average of 64.7 days on market and only half of homes selling at or above asking price, this is a market where a prepared buyer with a solid inspector and a patient agent can potentially get a deal.
The list-to-sale ratio of 0.976 means sellers are, on average, accepting about 97.6 cents on the dollar. In a market where most Philadelphia neighborhoods see ratios at or above 0.98, that small gap represents real money on a $150K transaction, potentially $3600 in savings, or more on a higher-priced home.
Buyer note: The longer DOM here reflects both negotiating room and selective buyers. Homes that sit longest are often overpriced or need more work. The right home at the right price still moves.
In regard to the market, it's a block-by-block kind of area, so trust your instincts if you find a spot you like. Don't be afraid to put in a strong offer on a house you really want.
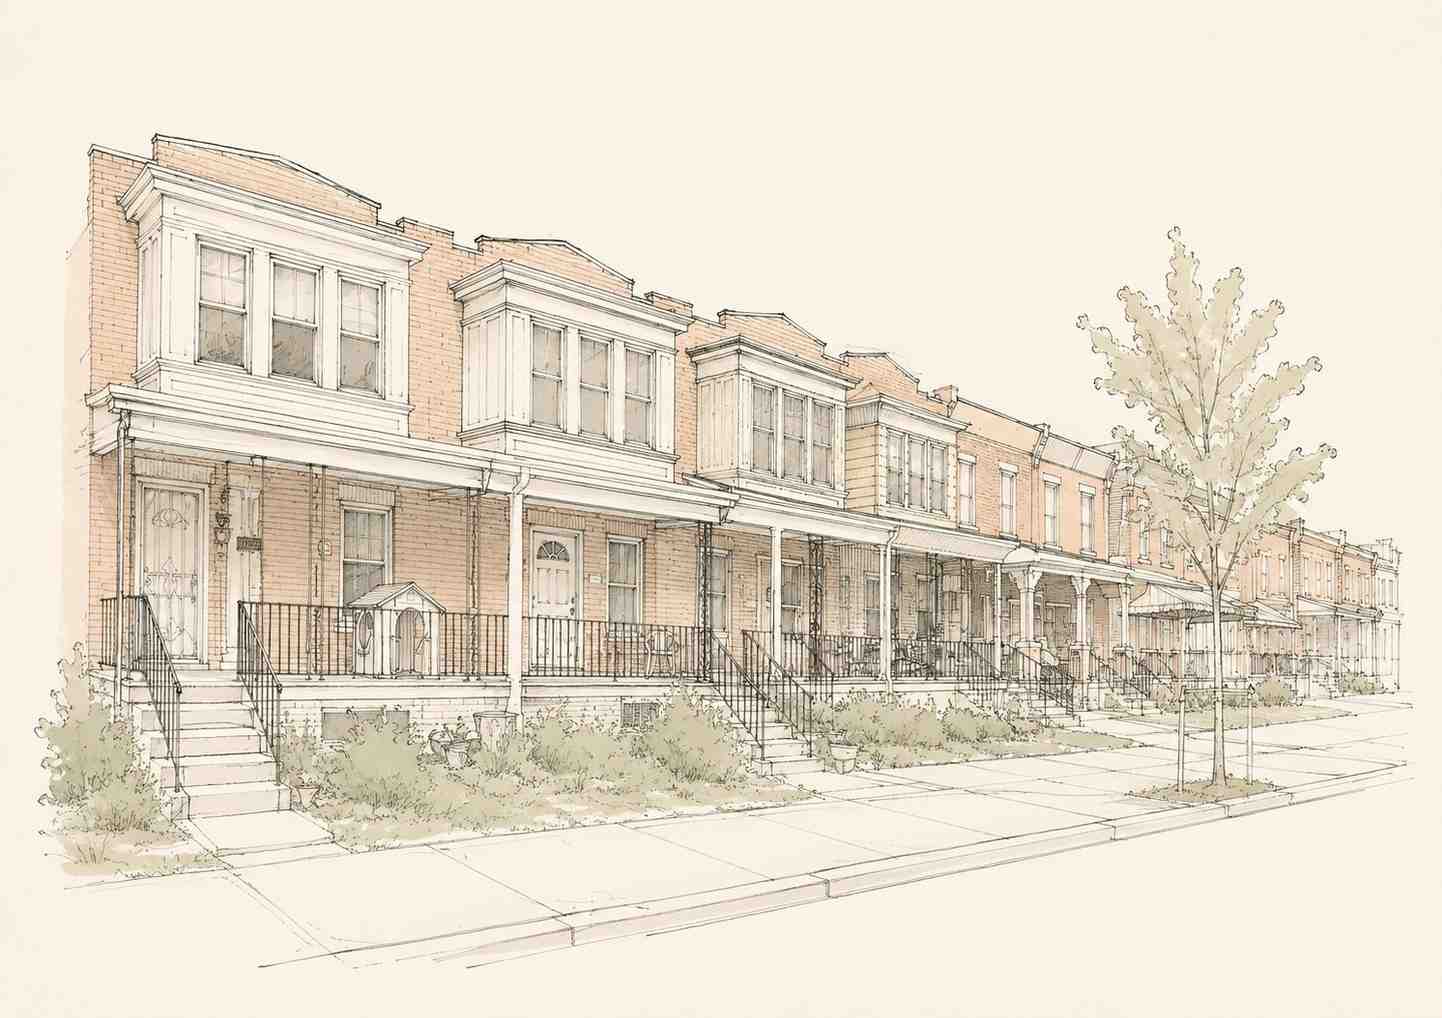
Frankford
| Median Sold Price (90 days) | $175,000 |
| Average Days on Market | 43.3 days |
| % Sold At or Above Asking | 65.7% |
| Avg. List-to-Sale Ratio | 1.000 |
| Closed Sales (90 days) | 35 sales |
| Active Listings (snapshot) | 42 active listings |
Frankford is the most interesting neighborhood on this list because it shows up on both our value and hotness rankings. Frankford combines one of the city's lower entry prices with enough market activity to give buyers options without the intense competition found in Philadelphia's hottest neighborhoods.
Think of Frankford as the crossover pick, affordable enough to score high on value, active enough to rank among the hottest. It has the most active listings of any neighborhood on this list (42), meaning buyers have real selection. But those homes are also moving within 43 days on average.
Buyer strategy: Frankford rewards preparation. With 42 active listings, you have options, but the best-priced, best-conditioned homes still move fast. Have your pre-approval ready and your non-negotiables defined before you start touring.
Frankford has strong access to public transportation, which is a real cost consideration to factor in. That connectivity is a huge benefit for commuters.
Logan
| Median Sold Price (90 days) | $150,000 |
| Average Days on Market | 53.1 days |
| % Sold At or Above Asking | 48.1% |
| Avg. List-to-Sale Ratio | 0.971 |
| Closed Sales (90 days) | 27 sales |
| Active Listings (snapshot) | 23 active listings |
Logan rounds out the under-$175K tier with some of the highest negotiating room in this analysis. Only 48% of homes are selling at or above asking, meaning just over half of buyers here are successfully purchasing below the list price. Logan stood out because buyers were less likely to pay at or above the asking price than in many other Philadelphia neighborhoods, creating more opportunities to negotiate.
The list-to-sale ratio of 0.971 is the lowest on this list among the active, healthy markets. On a $150,000 home, that gap could represent several thousand dollars in negotiated savings, more than enough to cover closing costs or a significant system repair.
Buyers have more leverage here. It's more of a buyer's market than some of the other areas, with opportunities to negotiate below asking and sellers who are often more open to making repairs.
Port Richmond
| Median Sold Price (90 days) | $225,000 |
| Average Days on Market | 60.8 days |
| % Sold At or Above Asking | 44.4% |
| Avg. List-to-Sale Ratio | 0.976 |
| Closed Sales (90 days) | 81 sales |
| Active Listings (snapshot) | 98 active listings |
Port Richmond gives buyers something that's increasingly hard to find in Philadelphia's under-$350K market: options. 81 closed sales and 98 active listings in the same period. For a buyer who feels frustrated by thin inventory elsewhere, Port Richmond is the rare Philadelphia neighborhood where you can actually take your time and compare listings.
The 44.4% rate of homes selling at or above asking, the lowest on this list, combined with a 60.8-day average DOM, points to a market where sellers are frequently negotiating. Port Richmond stands out as one of the strongest options for buyers who want room to negotiate and a larger selection of homes.
With 98 active listings, this is also a neighborhood worth watching with saved searches, new inventory appears regularly, and the market moves at a pace that allows real deliberation.
There's more inventory here compared to somewhere like Fishtown, where homes are gone almost as soon as they list. In Port Richmond, you can typically see a few homes on a weekend without feeling rushed to make a decision.
Want to see active listings in these neighborhoods right now? Start your search here, or reach out, and we'll pull a custom list.
Which Neighborhoods Give Buyers the Most Negotiating Room?
The chart below shows how the value neighborhoods compare to the hottest markets in terms of negotiation leverage and buyer competition.
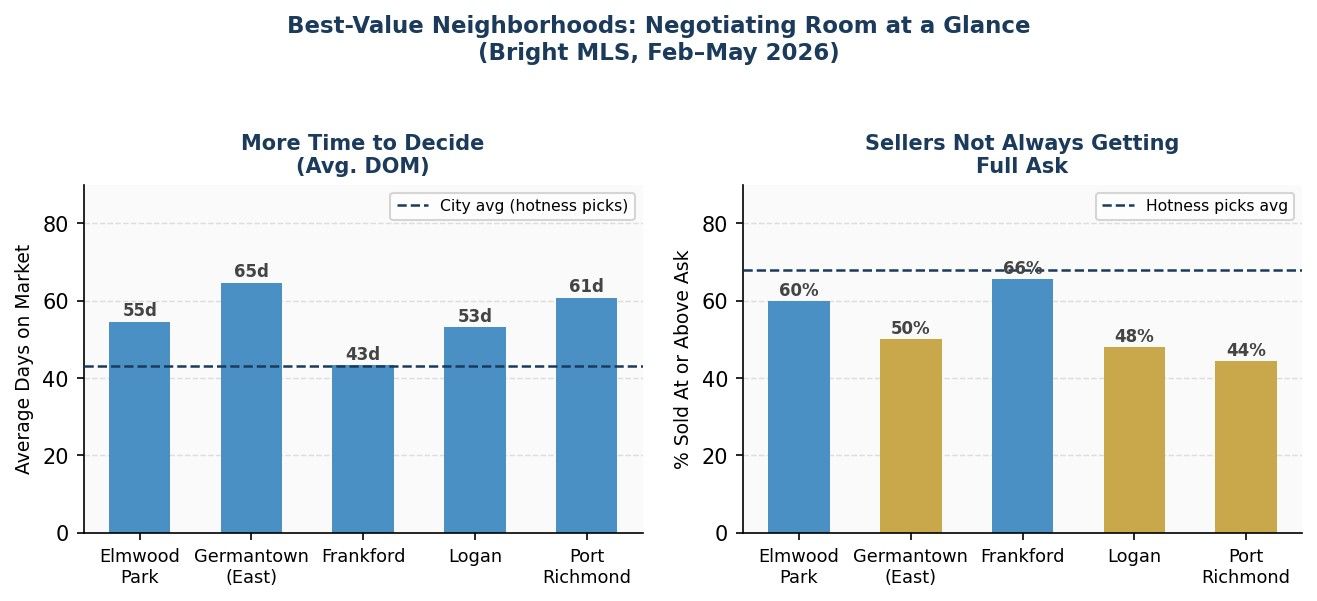
The dashed lines represent the approximate average for the hotness picks. Value neighborhoods sit above that line for DOM (more time) and mostly below it for % at or above asking (more room).
How Value Neighborhoods Compare to the Hottest Markets Under $350K
Same county, same 90-day window, same $350K ceiling. Here's how the value picks compare directly to the hotness picks across the four key metrics:
| Neighborhood | List | Med. Price | Avg DOM | % At/Above | Ratio |
| Burholme | Hottest #1 | $297,000 | 23.9 days | 70.0% | 1.018 |
| Morrell Park | Hottest #2 | $315,000 | 20.3 days | 68.4% | 1.009 |
| Parkwood | Hottest #3 | $322,000 | 22.4 days | 64.3% | 1.000 |
| Bridesburg | Hottest #4 | $255,500 | 32.7 days | 68.2% | 0.995 |
| Manayunk | Hottest #5 | $305,000 | 50.0 days | 72.0% | 1.008 |
| — — — | — — — | — — — | — — — | — — — | — — — |
| Elmwood Park | Value #1 | $150,000 | 54.6 days | 60.0% | 0.988 |
| Germantown (East) | Value #2 | $149,950 | 64.7 days | 50.0% | 0.976 |
| Frankford | Value #3 | $175,000 | 43.3 days | 65.7% | 1.000 |
| Logan | Value #4 | $150,000 | 53.1 days | 48.1% | 0.971 |
| Port Richmond | Value #5 | $225,000 | 60.8 days | 44.4% | 0.976 |
The pattern is clear. Hotness picks = higher price, faster pace, less room to negotiate. Value picks = lower price, more time, more opportunity to come in under list.
Value vs. Hot Neighborhoods: Which Strategy Fits You?
These aren't competing recommendations — they're tools for different buyer situations.
The Best Value list is for you if…
- You want your budget to stretch further.
- You prefer time for inspections and due diligence.
- Negotiating room matters more than buying in the fastest-moving market.
The Hottest Neighborhoods list is for you if…
- You're prepared to move quickly.
- You want to buy in areas with the strongest current demand.
- You're comfortable competing with other buyers.
Start by understanding what you actually want in a home and a neighborhood, rather than chasing whether an area is 'hot.' Neighborhoods where homes are going over asking are likely to keep appreciating, but ultimately it comes down to deciding what matters most to you and focusing your search there, regardless of neighborhood.
The Full Picture: Price vs. Speed
The chart below plots all 10 featured neighborhoods — five value picks and five hotness picks, on two axes. The upper-left quadrant is where value buyers want to be: lower prices, more time to decide.
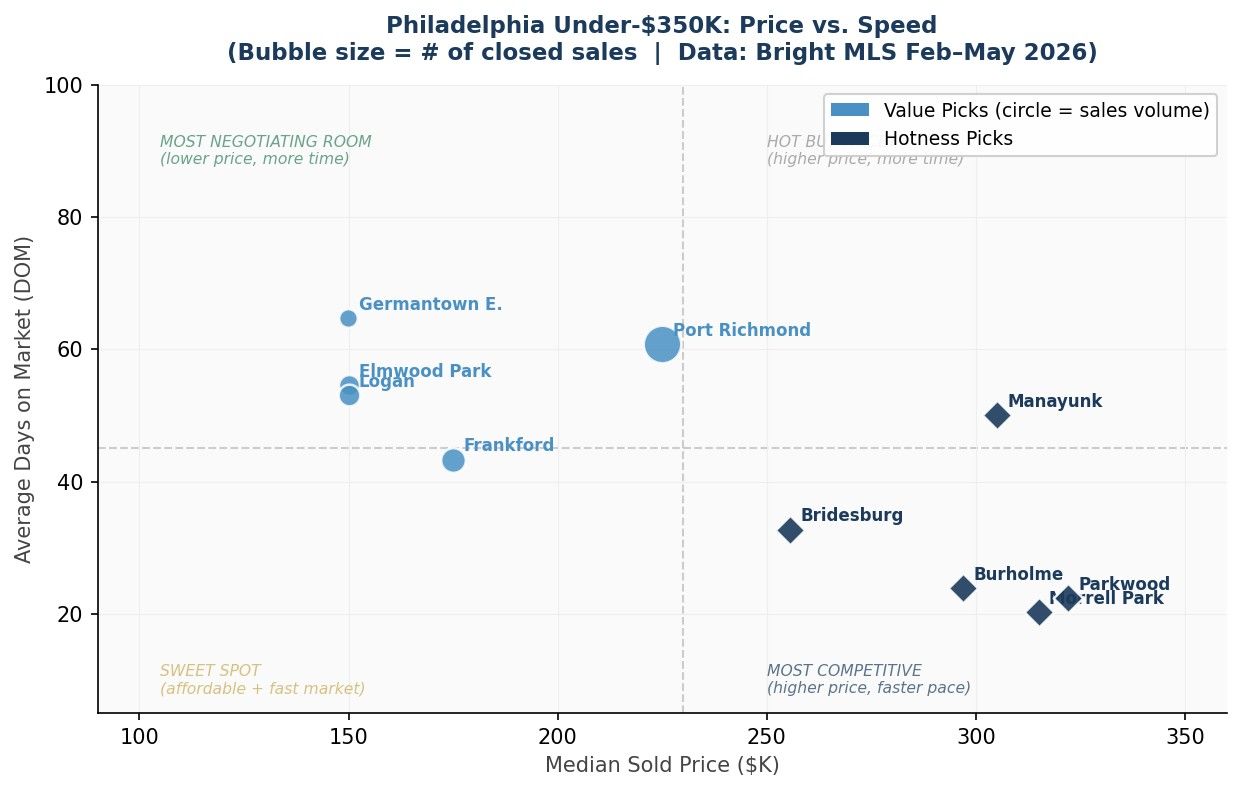
The cluster of blue circles in the upper-left is the value picks. The navy diamonds in the lower-right are the hotness picks. Frankford is the exception: it crosses into both lists, sitting at a lower price with a faster pace than most value picks.
Value pick medians range from $150K to $225K. The hottest picks range from $255K to $322K. Same city, same 90-day window, same $350K ceiling, and a very different buyer experience.
The Bottom Line on Philadelphia County Value
Finding value in Philadelphia's under-$350K market isn't just about finding the cheapest home. The neighborhoods in this report stood out because they offered the strongest combination of affordability, inventory, negotiating room, and market activity based on our analysis.
If you're looking for more buying power and a little more breathing room during your home search, these neighborhoods are a great place to start.
If you'd rather focus on the neighborhoods where competition is strongest, compare these rankings with our Hottest Neighborhoods Under $350K in Philadelphia report. Looking at both reports can help you decide which buying strategy best fits your goals.
Ready to find out where your budget goes furthest in Philadelphia County? Reach out to our team, and let us help map out options based on your budget, timeline, and the neighborhoods that best match your priorities.
Frequently Asked Questions
Can I get a mortgage on a $150,000 home in Philadelphia?
Yes, conventional, FHA, and first-time buyer programs all work in these price ranges. Some buyers assume that lower-priced homes are harder to finance, but that's not generally true. What matters is the condition of the property (lenders scrutinize homes that need significant work) and your own qualifying factors.
How do value neighborhoods compare for long-term appreciation?
This analysis covers a 90-day period, so it isn't designed to measure or predict long-term appreciation. Instead, it identifies neighborhoods where buyers currently have the strongest combination of affordability, inventory, negotiating room, and market activity.
How often will this data be updated?
We pull fresh data from Bright MLS each quarter and update both the value and hotness rankings. Markets shift, and a neighborhood on this list today may look different in three months.
What if the neighborhood I want isn't on this list?
Many neighborhoods under $350K are still worth exploring; they simply ranked lower based on our combination of affordability, inventory, negotiating room, and market activity.

Robin Martin
Realtor® | Premier Home Team | Keller Williams Empower | PLACE
or another way